Showing posts with label Market Overview. Show all posts

Monday, October 18, 2021

Monetary Policy Review : October 2021

Monetary Policy Review : October 2021

The Monetary Policy Committee (MPC) today unanimously voted to keep the policy Repo Rate unchanged at 4.0% respectively.  It also voted in favor to continue with accommodative stance (with 5 to 1 majority, same as last meeting) as long as necessary to revive and sustain growth on a durable basis  and continue to mitigate the impact of COVID-19 on the economy, while ensuring that inflation remains within the target going forward.  

In addition to above, Reserve Bank of India (RBI) announced following liquidity and regulatory measures: 
  • Announced  calibrated  increase  in  quantum  of  VRRR  auctions  to  INR  6  lakh  crore  (from  INR  4  lakh crore) in four tranches of INR 50,000 crore each over next 2 months. Governor also mentioned that RBI may consider complementing this with 28-day VRRR auctions in a similar calibrated manner.  
  • Extended  the  On  Tap  Special  Long-Term  Repo  Operations  for  Small  Finance  Banks  of  INR  10,000 crore till 31 December 2021.  
  • Extended the enhanced aggregate Ways and Means Advances limit for States / Union Territories of INR 51,560 crores by another 6 months till 31 March 2022. 
On Economic Growth: The economic recovery is progressing well supported by receding cases, easing restrictions  and  improvement  in  pace  of  vaccination.  The revival  has  been  broad  based  with  improvement  in  PMIs, steady  growth  in  industrial  production,  forecast  of  strong food  grain  production,  robust  non-oil  non-gold  exports. 
Further, high frequency indicators like cement production, railway  freight  traffic,  e-way  bills,  power  generation,  etc.  also points at fast pace normalization. However, select segments like contact intensive services, aviation etc. continue to remain  under pressure. While Q1FY22 GDP growth  came in slightly lower  than estimated,  RBI  has  retained  the  full  year  growth  forecast  and  has  revised  up  its  growth  estimate  for Q2FY22 and Q3FY22. However, RBI continues to emphasis the need to nurture the recovery given the relatively  low  capacity  utilization,  uncertain  external  sector,  high  commodity  prices  and  impact  of monetary policy normalization in advanced economies.

On  Inflation:  The  average  inflation  for  July  and  August  2021  has  been  considerably  lower  than  RBI’s  forecast.  This  was  mainly  driven  by  soft  momentum  in  vegetable  prices  and favourable base effect. However, fuel prices inched up further on back of rise in international crude prices and core inflation (CPI ex food & fuel) continues to remain sticky and at elevated level. 

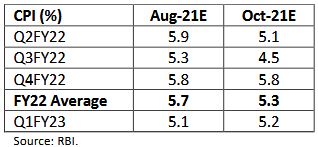
In view of lower food inflation,  expectation of record food grain production, supply side measures by government on edible oil and pulses,  lower pass through  of  high  input  prices,  etc.  RBI  has  revised  down  its  CPI  forecast  by  80  bps  for  Q2FY22  and Q2FY23. Consequently, the full year target has been revised down by 40 bps.

Conclusion and Outlook 
The  status  quo  of  monetary  policy  and  increase  in  VRRR  quantum  was  largely  in  line  with  consensus expectations and there was no major surprise in the policy. However, no new G-SAP announcement for 
Q3FY22  was  perceived  a  little  negative  by  the  market  and  yields  at  the  longer  end  inched  up  slightly.  However,  Governor  in  his  statement  stressed  that  RBI  retains  the  flexibility  of  conducting  G-SAP  and  using  other  liquidity  tools  including  operation  TWIST  and  OMOs  as  and  when  deemed  necessary. 

Governor  reemphasized  that  increase  in  quantum  of  VRRR  should  not  be  perceived  as  reversal  from accommodative stance. RBI expects that the inter bank liquidity (excluding the VRRR) is likely to remain in the range of INR 2 to 3 lakh crore by early December 2021 i.e. ~2% of NDTL from ~4.5% currently.  

Going forward, the fixed income market can face some headwinds as factors like elevated crude prices, resilient  retail  inflation,  increase  in  inflation  expectations,  high  SLR  holding  of  banks,  good  recovery 
momentum,  etc.  may  adversely  impact  the  yields.  Further,  hawkish  commentary  by  US  FOMC,  rise  in international commodity prices, etc. can put upward pressure on Gsec yield too.  

However, despite the fixed income environment being not so favourable over the past few months, the rise  in  yields  has  been  rather  modest  till  now,  primarily  driven  by  continued  RBI  intervention  through 
deployment  of  conventional  and  unconventional  tools.  Over  the  past  one  and  half  year,  RBI  has extensively  used  policy  tools  like  LTROs,  TLTROs,  operation  TWIST,  G-SAP, etc. to achieve “orderly 
evolution” of yield curve. Further, the buoyant revenue collections have reduced the risk of fiscal slippage. Also, borrowing for compensation cess has been subsumed within the Government borrowing program and there is likely to be no increase from budgeted borrowing program.  

In view of the above, we expect yields to trade within a range with an upward bias. However, given the increase  in  VRRR  quantum  and  possibility  of  reverse  repo  rate  hike  in  coming  months,  we  expect  the yields at shorter end to rise faster. In view of the aforesaid and relatively steep yield curve, we continue to recommend investments into short to medium duration debt funds, possibly, in a staggered manner 
in line with individual risk appetite.

Sources: Various publications

Disclaimer: The information provided herein is based on publicly available information and other sources believed to be reliable, but involve uncertainties that could cause actual events to differ materially from those expressed or implied in such statements. The document is given for general and information purpose and is neither an investment advice nor an offer to sell nor a solicitation. While due care has been exercised while preparing this document, we do not warrant the completeness or accuracy of the information. We will not accept any liability arising from the use of this material. The recipient of this material should rely on their investigations and take their own professional advice.

Follow, Like, subscribe and share

"Your Trust, Our Financial Expertise."

Infyture, Investment For Your Future

Email: infyture@gmail.com

Website: http://infyture.wordpress.com

Facebook Page: https://www.facebook.com/infyture4future/

Youtube:https://www.youtube.com/channel/UCjOxVGTKQiK5O0mdcuMBCdw?view_as=subscriber

Blogger: https://infyture.blogspot.com/

WhatsApp: https://wa.me/message/SXE3AQCBR3O4B1

Telegram: https://t.me/infyture

Goal Based Planning || Equity Tip || Demat Account || Mutual Fund Investment || Life Insurance || General & Health Insurance || PMS & mini PMS || Retirement Planning || NPS Enrollment

Monday, March 8, 2021

Stock market News as on 08-03-2021

Stock market News as on 08-03-2021


Nifty tops 15,000 mark mirroring firm global cues; Sensex up 350 points

Tracking the global mood, the Indian benchmark indices traded around 1% higher in Monday's early deals. Investors reacted to US President Joe Biden's $1.9 trillion corona virus relief package passed in the Democratic-controlled Senate on March 6 while keeping a close watch on the US bond yields. The yields on US 10-year Treasuries hit a one-year high of 1.625% last Friday in the wake of positive US jobs data and rising inflation, and stood at 1.60% on Monday.

At 9:38 AM, the frontline S&P BSE Sensex was trading at 50,772, up 369 points or 0.72%. Market breadth is positive and out of a total of 2,287 shares traded on the Bombay Stock Exchange, 1,662 advanced while 497 declined and 128 remained unchanged. The broader Nifty 50 was at 15,043, levels, up 104 points or 0.70%. The Nifty sectoral indices were painted green, led by Nifty PSU Bank index, up 2%.

The Week that was – March 1 to March 5, 2021

Key indices logged modest gains amid volatile swings during the week. The Nifty index dropped below the psychological 15,000 mark. Value buying emerged after India's GDP returned to positive territory after contracting for two straight quarters. Stabilizing US Treasury yields, hopes surrounding global COVID-19 vaccination programme and the passing of $1.9 trillion US stimulus package also boosted gains. However, global stocks weakened towards end of the week amid rising bond yields. Rising crude oil prices also weighed on the sentiment as higher crude oil prices could increase fiscal deficit, current account deficit and stoke fuel price inflation. Auto stocks were in demand during the week.

In the week ended on Friday, March 5, 2021, the Sensex surged 1,305.33 points or 2.66% to settle at 50,405.32. The Nifty50 index soared 408.95 points or 2.81% to settle at 14,938.10. The BSE Mid-cap index rose 609.15 or 3.05% to settle at 20,587.80. The BSE Small cap index jumped 780.67 points or 3.87% to settle at 20,936.02.

Global Markets

Asian shares rallied on Monday while the dollar held near three-month peaks after the U.S. Senate passage of a $1.9 trillion stimulus bill and a surprisingly strong payrolls report augured well for a global economic rebound. There was also upbeat news in Asia, as China’s exports surged 155% in February compared with a year earlier when much of the economy shut down to fight the corona virus. The prospect of yet faster growth helped MSCI’s broadest index of Asia-Pacific shares outside Japan firm 0.4%. Japan’s Nikkei gained 1.2%, while S&P 500 futures rose 0.3%, after a sharp turnaround on Friday.

OIL, RUPEE & FIIs

Crude Oil: The oil prices were at the highest levels in more than a year after Yemen's Houthi forces fired drones and missiles at the heart of Saudi Arabia's oil industry on Sunday, raising concerns about production. Brent climbed $1.09 a barrel to $70.45, while US crude rose $1.08 to $67.17 per barrel.

Indian Rupee: The rupee slumped by 19 paise to close below the 73 mark against the US currency on Friday due to a stronger dollar and risk aversion in the global markets. At the inter bank forex market, the local unit opened at 72.98 against the greenback and traded in the range of 72.73 - 73.09 during the day. The rupee finally ended at 73.02 against the American currency, registering a fall of 19 paise over its previous closing.

FPIs: As the rising bond yields in the US cause panic in the global markets, foreign portfolio investors (FPI) have turned to sell their holdings. FPIs have pulled out a net Rs 881 crore from the Indian equity market in the first week of March. They have pulled out a net investment of Rs 5,595 crore from the debt segment, as shown in NSDL Website.

Week Ahead

Trend in global markets, macro data, movement of rupee against the dollar, Brent crude oil price movement and investments by foreign portfolio investors (FPI) and domestic institutional investors (DII) will be watched. Global cues will continue to be in focus as resurgence in virus cases around the world, leads to more restrictions and more pressure on economic recovery. Updates related to COVID-19 will be closely watched. Also, on the radar will be news on Covid vaccine development. From here on the pace of the improvement of economic indicators along with outcomes of a possible vaccine or cure for COVID-19 would determine the movement of the market.

On the macro front, the Industrial Production and Manufacturing Production data for January will be released on March 12, 2021.

Overseas, China will announce inflation rate for February on March 10, 2021. US will also announce inflation rate for February on March 10, 2021. In Europe, the European Central Bank (ECB) will announce its interest rate decision on March 11, 2021.

Sources: Various publications

Disclaimer: The information provided herein is based on publicly available information and other sources believed to be reliable, but involve uncertainties that could cause actual events to differ materially from those expressed or implied in such statements. The document is given for general and information purpose and is neither an investment advice nor an offer to sell nor a solicitation. While due care has been exercised while preparing this document, we do not warrant the completeness or accuracy of the information. We will not accept any liability arising from the use of this material. The recipient of this material should rely on their investigations and take their own professional advice.

Follow, Like, subscribe and share

"Your Trust, Our Financial Expertise."

Infyture, Investment For Your Future

Email: infyture@gmail.com

Website: http://infyture.wordpress.com

Facebook Page: https://www.facebook.com/infyture4future/

Youtube:https://www.youtube.com/channel/UCjOxVGTKQiK5O0mdcuMBCdw?view_as=subscriber

Blogger: https://infyture.blogspot.com/

WhatsApp: https://wa.me/message/SXE3AQCBR3O4B1
Telegram:
https://t.me/infyture

Goal Based Planning || Equity Tip || Demat Account || Mutual Fund Investment || Life Insurance || General & Health Insurance || PMS & mini PMS || Retirement Planning || NPS Enrollment

Monday, February 22, 2021

Stock Market Analysis : Nifty below 15000 mark with Amid Volatility

Stock Market Analysis : Nifty below 15000 mark with Amid Volatility

The Indian markets slid in the early deals of Monday's volatile session, with public sector banks being the top drags. Markets had registered sharp gains post the Union Budget, but last week profit-taking was witnessed. Markets might witness volatile trade this week amid monthly derivatives expiry. 
At 10:10 AM, the front line S&P BSE Sensex was trading at 50,582, down 316 points or 0.62%. Market breadth is flat and out of a total of 2,456 shares traded on the Bombay Stock Exchange,1,181 advanced while 1,144 declined and 131 remained unchanged. The broader Nifty 50 was at 14,902, levels, down 79 points or 0.50%. 

The Nifty sectoral indices, barring the Nifty Metal index, were painted red. In the broader markets, the S&P BSE Midcap and Small cap indices were up 0.13% and 0.3%, respectively. 

The Week That Was–Feb 15 To Feb 19, 2021

Key indices ended with modest losses as investors booked profits after recent rally. Rising global and local bond yields impacted sentiment. The up move was triggered by a range of positive developments, including a high-spending union budget, strong corporate earnings, robust foreign fund flows and progress on COVID-19 vaccinations. 

The Sensex settled below the key 51,000 level while the Nifty ended below the psychological 15,000 mark. Both these indices retreated after scaling record highs. However, the broader markets that are BSE Midcap index and the BSE Small cap Index, both, ended in the green last week.

In the week ended Friday, February 19, 2021, the Sensex dropped 654.54 points or 1.27% to settle at 50,889.76. The Nifty 50 index shed 181.55 points or 1.20% to settle at 14,981.75. The BSE Midcap index rose 124.49 or 0.63% to settle at 20,035.52. The BSE Small cap index added 241.36 points or 1.23% to settle at 19,863.41.

Global Markets

Asian share markets inched higher to day as expectations for faster economic growth and inflation globally batter bonds and boost commodities, though rising real yields also make equity valuations look more stretched in comparison. 

MSCI’s broadest index of Asia-Pacific shares outside Japan added 0.1%, after easing from a record top late last week as the jump in US bond yields unsettled investors.

Japan’s Nikkei recouped 1.0% and South Korea 0.4%, while E-Mini futures for the S&P 500 were a fraction firmer.

Oil, Rupee & FIIs 

Crude Oil: Oil prices have gone along for the ride, aided by tightening supplies and freezing weather, giving Brent gains of 21% for the year so far. Early Monday, Brent crude futures were up 43 cents at $63.34 a barrel, while US crude added 11 cents to $59.35.

Indian Rupee: Buoyed by foreign fund inflow and weaker US dollar, the Indian rupee is trading at its highest level in almost a year. On Friday the rupee closed flat at 72.65 against the greenback, as foreign funds continued to pump monies into Indian markets. 

FPIs: On Friday, foreign institutional investors (FIIs) net bought shares worth Rs 118.75 crore, while domestic institutional investors (DIIs) net sold shares worth Rs 1,174.98 crore in the Indian equity market.

Foreign portfolio investors (FPIs) invested Rs 24,965 crore in Indian markets in February so far. According to depositories’ data, FPIs pumped in Rs 24,204 crore into equities and Rs 761 crore in the debt segment, taking the total net investment to Rs 24,965 crore during February 1-19.

Week Ahead

Trading could be volatile this week as traders roll over positions in the F&O segment from the near month January series to February series. The February 2021 F&O contracts will expire on Thursday.

Trend in global markets, macro data, movement of rupee against the dollar, Brent crude oil price movement and investments by foreign portfolio investors (FPI) and domestic institutional investors (DII) will be watched.

On the macro front, India's gross domestic product (GDP) for the fourth quarter will be released on February 26, 2021. India's infrastructure output data for January will be unveiled on February 26, 2021. 

Global cues will continue to be in focus as resurgence in virus cases around the world, leads to more restrictions and more pressure on economic recovery. Updates related to COVID-19 will be closely watched. Also, on the radar will be news on Covid vaccine development. From here on the pace of the improvement of economic indicators along with outcomes of a possible vaccine or cure for COVID-19 would determine the movement of the market.

China will announce Loan Prime Rate for 1 year and 5 years today. The United States Durable Goods Orders for January will be declared on February 25, 2021.

Sources: Various publications

Disclaimer: The information provided herein is based on publicly available information and other sources believed to be reliable, but involve uncertainties that could cause actual events to differ materially from those expressed or implied in such statements. The document is given for general and information purpose and is neither an investment advice nor an offer to sell nor a solicitation. While due care has been exercised while preparing this document, we do not warrant the completeness or accuracy of the information. We will not accept any liability arising from the use of this material. The recipient of this material should rely on their investigations and take their own professional advice.

Follow, Like, subscribe and share

"Your Trust, Our Financial Expertise."

Infyture, Investment For Your Future

Email: infyture@gmail.com

Website: http://infyture.wordpress.com

Facebook Page: https://www.facebook.com/infyture4future/

Youtube:https://www.youtube.com/channel/UCjOxVGTKQiK5O0mdcuMBCdw?view_as=subscriber

Blogger: https://infyture.blogspot.com/

WhatsApp: https://wa.me/message/SXE3AQCBR3O4B1

Telegram: https://t.me/infyture

Goal Based Planning || Equity Tip || Demat Account || Mutual Fund Investment || Life Insurance || General & Health Insurance || PMS & mini PMS || Retirement Planning || NPS Enrollment

Monday, October 12, 2020

Market Watch for 12th October 2020

Market Watch for 12th October 2020

The Indian markets rose nearly one per cent on Monday, ahead of the press conference of Finance  Minister  Nirmala  Sitharaman  on  economic  issues  at  12:30  pm  today.Among headline  indices, in early trades, the  S&P  BSE  Sensex  gained  300  points  to  40,860  levels, and  the  Nifty 50  index  reclaimed  the  psychological  level  of  12,000  for  the  first  time  since February 24, 2020. At 10:30 AM, the frontline S&P BSE Sensex was trading at 40,768, up 258 points or 0.64%. Market breadth is positive and out of a total of 2,269 shares traded on the Bombay Stock Exchange,  982 advanced while  1,140 declined  and 147 remained unchanged. The  broader Nifty 50 was at 11,973 levels,up 59 points or 0.5%. The  trend  among  Nifty  sectoral  indices  was  mixed,  with  Nifty  Bank  index,  up  1%,  leading the list of gainers.The  broader  market  continued  to  under perform,  with  the  S&P  BSE  Midcap  and  Smallcap indices trading 0.3% higher, each.

Benchmark  indices  registered  strong  gains  during  the  week  as  companies  released  strong Q2  business  updates.  The  RBI  announced  a  slew  of  liquidity  measures  to  support  the economy on Friday. The Sensex settled above 40,500 level while the Nifty 50 index settled above 11,900 mark Positive global cues also boosted sentiment. IT  stocks  logged  strong  gains  during  the  week.  In  the  week  ended  on  Friday,  9  October 2020, the Sensex surged 1,812.44 points or 4.68% to settle at 40,509.49. The  Nifty 50  index  jumped  497.25  points  or  4.36%  to  settle  at  11,914.20.  The  BSE  Midcap index fell 47.7 or 0.32% to settle at 14,765.55. The BSE Smallcap index shed 4.23 points or 0.03% to settle at 14,966.21.

Global Markets:

Chinese stocks led Asian markets higher on Monday as investors bet on a steady recovery for the world’s no. 2 economy, though caution about the fate of US stimulus kept the dollar firm and a central bank policy tweak unwound some of the yuan’s gains. MSCI’s broadest index of Asia-Pacific  shares  outside  Japan rose  0.8%  to  2-1/2-year  highs, buoyed by a 2% gain in Chinese blue chips and a 1.5% rise by Hong Kong’s Hang Seng index. Japan’s Nikkei slipped 0.3% as investors fretted about corporate earnings.

Crude Oil& Gold: Brent crude futures slipped 0.9% to $42.48 a barrel and US crude futures were down about 0.8% at $40.26.Gold  held  steep  Friday  gains  at  $1,927  an  ounce  as  investors  stuck  with  bets  that  US stimulus would eventually arrive and drive inflation to the benefit of bullion.

Indian Rupee: The rupee strengthened by 8 paise to close at 73.16 (provisional) against the US  dollar  on  Friday  after  the  Reserve  Bank  of  India  decided  to  keep  benchmark  interest rate unchanged.

FPIs & DIIs: Net-net, foreign portfolio investors (FPIs) were sellers of domestic stocks to the tune of Rs 39.39 crore, data available with NSE suggested. DIIs were net buyers to the tune of Rs 126.61 crore, data suggests.10-year Bonds:India 10-year bond yield fell 1.30 per cent to 5.93 after trading in 5.92-6.04 range.

Week Ahead

Quarterly results, macro data, movement of rupee against the dollar, Brent crude oil price movement  and  investments  by  foreign  portfolio  investors  (FPI)  and  domestic  institutional investors (DII) will be watched.

Global  cues  will  continue  to  be  in  focus  as  resurgence  in  virus  cases  around  the  world, leads  to  more  restrictions  and  more  pressure  on  economic  recovery.  Updates  related  to COVID-19  will  be  closely  watched.  Also  on  the  radar  will  be  news  on  Covid  vaccine development.  From  here  on  the  pace  of  the  improvement  of  economic  indicators  along with outcomes of a possible vaccine or cure for COVID-19 would determine the movement of the market.

Markets across the globe will continue to remain volatile. US President Donald Trump and Joe  Biden,  the  Democratic  nominee,  wrapped  up  their  first  presidential  debate  on  29 September   with   heated   exchanges.   Two   more   debates   between   the   presidential candidates are scheduled to Tuesday, 3 November 2020.

China will announce inflation rate for September on 15 October 2020. The US inflation rate for  September  will  be  announced  tomorrow.  US  Retail  Sales  for  September  will  be announced on 16 October 2020. 

In Europe, the ZEW Economic Sentiment Index for October will be declared tomorrow.

Sources: Various publications

Disclaimer: The information provided herein is based on publicly available information and other sources believed to be reliable, but involve uncertainties that could cause actual events to differ materially from those expressed or implied in such statements. The document is given for general and information purpose and is neither an investment advice nor an offer to sell nor a solicitation. While due care has been exercised while preparing this document, we do not warrant the completeness or accuracy of the information. We will not accept any liability arising from the use of this material. The recipient of this material should rely on their investigations and take their own professional advice.
Follow, Like, subscribe and share

"Your Trust, Our Financial Expertise."

Infyture, Investment For Your Future

Email: infyture@gmail.com

Website: http://infyture.wordpress.com

Facebook Page: https://www.facebook.com/infyture4future/

Youtube:https://www.youtube.com/channel/UCjOxVGTKQiK5O0mdcuMBCdw?view_as=subscriber

Blogger: https://infyture.blogspot.com/

Goal Based Planning || Equity Tip || Demat Account || Mutual Fund Investment || Life Insurance || General & Health Insurance || PMS & mini PMS || Retirement Planning || NPS Enrollment

Friday, July 10, 2020

Analysis of India's Current Account Surplus

Analysis of India's Current Account Surplus

India’s current account balance turned to a surplus (after more than a decade) of 0.1% of GDP (or USD 0.6 billion) for the January-March 2020 period, compared to a current account deficit of 0.7% of GDP (or USD 4.6 billion) in the year ago period. India saw a current account deficit of 0.4% in the October-December 2019 period. For the full fiscal year 2019-20, the current account deficit narrowed to 0.9% of the GDP compared to 2.1% in financial year 2018-19.


There are two factors that have primarily resulted in this current account surplus – a narrowing trade deficit and a significant increase in net invisible receipts.

India’s trade deficit narrowed to USD 35 billion (4.8% of GDP) in quarter ended March 2020 from USD 36 billion (5% of GDP) in the quarter ended December 2019. The general slowdown in imports due to the Covid-19 crisis along with a significant reduction in oil prices played a major role in reducing the trade deficit. Additionally, India’s export dependence is lower compared to other emerging market economies. The composition of discretionary goods (the demand for which reduces the most in such crises) such as luxury goods, auto, etc., is also low in India’s exports.

India’s net invisible receipts increased to USD 35.6 billion (4.8% of GDP) from USD 33.4 billion (4.6% of GDP). “Invisibles” include the import & export of services, private remittances from abroad and payments to foreign countries, and incomes earned by MNCs from their investments in India. The increase in net invisible receipts was driven mainly by an increase in private remittances. Remittances by Indians employed overseas and other private transfers rose by 14.8% from a year ago to USD 20.6 billion. Net outflows from overseas investment income payments also decreased to USD 4.8 billion from USD 6.9 billion a year ago. Net services receipts increased on the back of a rise in net earnings from computer and travel services on a year-on-year basis.

Foreign Direct Investments (FDI) have also been rising. Net FDI at USD 12.0 billion in Q4 of 2019-20 was higher than USD 6.4 billion in Q4 of 2018-19. This, along, with the surplus in current account balance, may also help boost the performance of the Indian rupee. The Indian rupee has appreciated by more than 1% last week.

Overall, India’s external position might be well placed in comparison to most other emerging markets. It will, therefore, be interesting to observe the current account surplus and the performance of the Indian rupee in the coming months and quarters.

Sources: Various publications

Disclaimer: The information provided herein is based on publicly available information and other sources believed to be reliable, but involve uncertainties that could cause actual events to differ materially from those expressed or implied in such statements. The document is given for general and information purpose and is neither an investment advice nor an offer to sell nor a solicitation. While due care has been exercised while preparing this document, we do not warrant the completeness or accuracy of the information. We will not accept any liability arising from the use of this material. The recipient of this material should rely on their investigations and take their own professional advice.

Follow, Like, subscribe and share

"Your Trust, Our Financial Expertise."

Infyture, Investment For Your Future

Contact: +91-7990271953 // 8347871052

Email: infyture@gmail.com

Website: http://infyture.wordpress.com

Facebook Page: https://www.facebook.com/infyture4future/

Youtube:https://www.youtube.com/channel/UCjOxVGTKQiK5O0mdcuMBCdw?view_as=subscriber

Blogger: https://infyture.blogspot.com/


Financial Planning || Equity Tip || Demat Account || Mutual Fund Investment || Life Insurance || General & Health Insurance || PMS & mini PMS || Retirement Planning || NPS Enrollment

Tuesday, June 16, 2020

Sector Analysis of Plastic Products related Companies

Sector Analysis of Plastic Products related Companies

Sector Analysis of Plastic Products related Companies
Indian Plastic made a promising beginning in 1957 & today employs about 40 lakh people with around 30000 processing units the majority of which are small & medium enterprises.  The plastics industry is a growing industry in India. It has expanded at ~8% CAGR over the last five years. 

Supreme Industries ltd : CMP 1086: 

Best among Plastic industry. For the last 18 years this company is able to grow its revenue from 500 cr to 5000 cr ie. 10X and Profit from 3 cr to 500 cr i.e. again more than 10X hence investment in this company of 1 lakh is worth 2Cr. Ie. 200X. Stocks have moved from Undervaluation to High valuation. Where there is growth there is wealth. Many people in this group have been holding this company since 150, 6 years back. Still no need to hurry and can hold it for long term wealth. Current year revenue has also fallen by 2% and Net profit has grown by 4% respectively. Buying can be done only during fall near 730 and we can hold this multi-bagger stock for the long term.

Astral Poly Technik Ltd  CMP 866:

Good among Plastic industry with the base at Ahmedabad. Just listed 12 Years back near 8. During that time their revenue and profits were 100 cr and 10 cr. Today they are able to generate around sales and profits of around 2600 cr and 250 cr. Today’s profit is almost twice that of just 10 years back sales. High Growth sustained with low debt. Hence investment of 1 Lakh already 1 cr with the whole investment refunded in dividends. Many people in this group bought around 350 just 4 Years back and still there is no need to sell. Current Year revenue and profit have grown by 3% & 27% respectively shows muted demand affected by the global slowdown. New buying again could be done near 800 during any fall and can hold it for long term wealth creation. The company has acquired a 51% stake in “REX”, engaged In the business of Manufacturing & supply of corrugated and other plastic piping solutions against consideration of Rs. 75 cr paid in cash. 20% holding is with Different FPI and 6% with Mutual fund companies. 

Nilkamal Ltd CMP: 1070

Nilkamal Limited is in the manufacturing business of molded furniture and material handling products with diversified product profiles. They are also having a presence in the retail business of lifestyle furniture, furnishings, and accessories under its brand '& home' & Nilkamal Mattresses. Able to grow their revenue from 200 cr to 2000 cr and Profits from 10 cr to 120 cr during the last 15 years. Hence investment of  1 lakh is already 30 Lakh during the last 18 years. Many people in this group Bought Nilkamal just at 370, 4 years back, and still, there is no need to worry. New buying again can be done near 1400 and can hold it for long term wealth creation. 

Sources: Various publications

Disclaimer: The information provided herein is based on publicly available information and other sources believed to be reliable, but involve uncertainties that could cause actual events to differ materially from those expressed or implied in such statements. The document is given for general and information purpose and is neither an investment advice nor an offer to sell nor a solicitation. While due care has been exercised while preparing this document, we do not warrant the completeness or accuracy of the information. We will not accept any liability arising from the use of this material. The recipient of this material should rely on their investigations and take their own professional advice.

Follow, Like, subscribe and share

"Your Trust, Our Financial Expertise."


Infyture, Investment For Your Future
Contact: +91-7990271953 // 8347871052
Website: http://infyture.wordpress.com

Financial Planning || Equity Tip || Demat Account || Mutual Fund Investment || Life Insurance || General & Health Insurance || PMS & mini PMS || Retirement Planning || NPS Enrollment

Sector Overview of Electrical Equipment Producers

Sector Overview of Electrical Equipment Producers

Electrical Equipment Producers
This Industry is Having MCap of around 1 Lakh cr with Sales of 50000 cr & Profits 3000 cr. 

Industry growing by domestic consumption as well as increasing exports. Growth of 15% - 20% is seen for the last 2 decades. India was having 40 cr population without electricity till 2011 v/s just 80 lakh in China. Huge growth was there in this Industry as Electric Consumption/capita was very low but yes was increasing consistently. Many companies like Havells, Polycab, Fincables, HonAuto, VGuard were able to cash this growth. 


Havells: CMP 551: 

Company: A high growth, low debt, and highest market in this industry & strong R-O-E put company in the list of Wealth Creators. Able to increase its business from 200 cr to 10000 cr and Profit from 10 cr to 800 cr during the last 17 Years. Today’s Profis is 4X to Yesterday’s sales. During the Past 17 Years there was not a single year when sales were down. Hence investment of 1 lakh is already 4.7 Crore as well as 11 lakh dividend received during the past 17 years. Growth attracts wealth creation.  Havells by name seems to be some MNC but it was purchased from a person named Haveli Ram by Gupta and hence named Havells. Well diversified business in Switchgear, cables, Lighting & Consumer Durables (LLoyd), 55% sales comes from Cables & Electric Consumer. Many people in the group are holding this company since 80 and still there is no need to sell. It was and is a wealth creator company and best among the industry.  

Current Scenario : Since Q1 last year we have seen the sales in pressure after the long 2 decades. A challenging year with unfavorable macros, the slowdown in infrastructure activities, weak market liquidity and then final knock with COVID -19. Q4 commenced on a healthy note with Jan-Feb witnessing a revival in consumer products. But Covid-19 disrupted supply chain from China in Jan-Feb’ 20 and its contagion impacted the demand side with signs of fear and uncertainty among the trade channel since 15th March.  Havells closed its Offices, Factories, and Warehouses as per Government directive from 23rd March 2020 and moved to Work from Home (WFH). Consequently, there was a complete lockdown that crippled the revenue streams. We anticipate that ex-COVID the Q4 could have grown @ 9% against Dec’ YTD growth of (-) 1%. Hence Annual results are Too less than expected affected by slow down. Revenue has fallen by -6% and hence profit has fallen by -7% respectively. Results since Q1 are down and hence share is also trading at 52 week low. So current results were also inline as expected, muted results. 

Future: The demand continues to be weak, aggravated by real estate slow down, liquidity squeeze, and delays in projects. Should be prepared in advance that this year could be tough for this company, but yes can take benefit of this correction to accumulate, New Buying again can be done only during fall in the whole range of 540 to 420 and can hold this wealth creator for long term Multi-year rally. 60% strong Promoter Holding, 27% with FPI while 4% with MF companies. In the coming 2 years, we may see Havells enter into NIfty-50 also. 

HoneyAuto : CMP 26937: 

A wealth creator from Electric equip industry. Were making revenue and profits of around 300 cr and 9 cr 15 years back. Today able to make revenue and profits of 3400 cr and 500 cr. 10X growth in Business has created wealth for investors. Investment of 1 lakh is almost 1 cr with twice investment refunded in Dividends. Many people in the group have bought it near 2500 8 years back and it fell till 1500 (almost 50%) & it did not perform for a long 4 years. Today it is 10X. Patience is the name of the game. Some again bought it near 7500 in 2015. This is a debt-free, high margin, and India’s one of the TOP ROE company. 

Current Year sales have grown by 4% while Profits by 38%. The impact of COVID has been seen during Q4 cashflows. Yet, New buying still could be made during any falls near 18000 and can hold for long term wealth. 75% strong Promoter Holding while 15% with Varied MF companies.  

Finolex Cables Cmp: 260: 

Finolex Cables Limited is India's one of the largest and leading manufacturers of Electrical and Communication cables. A very good company form Other Elec. Equip. Have grown from the turnover & profits of 650 cr & 65 cr respectively during the year 2001 to today around 3200 cr and 400 cr respectively. Today's profit in the next 5 years will be more than yesterday’s revenue. Hence investment has grown 10X along with more then invested amount returned via dividends. Company with best margins in the segment and DebtFree status. Many people in this group are holding it since 140 during 2014. Our target as per 310% pot sheet was 548 and we have seen the rally from 140 to 750. Again currently in downward correction since last 2-3 years. Current Q 1 revenue have grown by Just 2% and hence Profits have fallen by -17% due to pressure on margins. Sales were affected by subdued construction activity, slowdown in automobile and communication sectors. It is expected that with Government formation completed by the end of June, programs to improve connectivity with broadband and related technologies, will gain momentum. Finolex has added Electrical Switches, LED based Lamps, Fans, low voltage MCBs and Water Heaters to its range of products. New Buying again can be done in the whole range of 336 to 296 & can hold it for long term wealth creation. DspBlackRock added 2.29 Lakh shares 3 Years back  at 450 and currently trading at better price. 19% Holding is with Varied MF companies while 7% with FPI.

VGuard CMP 243: 


Again a wealth creator from other electric equip industry. Debt free and high growth. Able to grow its revenue and profits by 100% during last 4-5 years. Many people in the group hold this company since long time near 10 and have accumulated during so many years. We have seen 20X rally during the last 10 years. Current year  revenue has grown by 11% while Profits are grown by 24% due to high cost effectiveness even after the effect of  Floods in Kerala last year. Still buying can be done during any fall near 175 and can hold it for long term wealth. Strong 64% Promoter Holding while 12% MF holdings and 13% FPI.

Sources: Various publications

Disclaimer: The information provided herein is based on publicly available information and other sources believed to be reliable, but involve uncertainties that could cause actual events to differ materially from those expressed or implied in such statements. The document is given for general and information purpose and is neither an investment advice nor an offer to sell nor a solicitation. While due care has been exercised while preparing this document, we do not warrant the completeness or accuracy of the information. We will not accept any liability arising from the use of this material. The recipient of this material should rely on their investigations and take their own professional advice.

Follow, Like, subscribe and share

"Your Trust, Our Financial Expertise."


Infyture, Investment For Your Future
Contact: +91-7990271953 // 8347871052
Website: http://infyture.wordpress.com

Financial Planning || Equity Tip || Demat Account || Mutual Fund Investment || Life Insurance || General & Health Insurance || PMS & mini PMS || Retirement Planning || NPS Enrollment

Disable copy