Monday, February 22, 2021

Stock Market Analysis : Nifty below 15000 mark with Amid Volatility

Stock Market Analysis : Nifty below 15000 mark with Amid Volatility

The Indian markets slid in the early deals of Monday's volatile session, with public sector banks being the top drags. Markets had registered sharp gains post the Union Budget, but last week profit-taking was witnessed. Markets might witness volatile trade this week amid monthly derivatives expiry. 
At 10:10 AM, the front line S&P BSE Sensex was trading at 50,582, down 316 points or 0.62%. Market breadth is flat and out of a total of 2,456 shares traded on the Bombay Stock Exchange,1,181 advanced while 1,144 declined and 131 remained unchanged. The broader Nifty 50 was at 14,902, levels, down 79 points or 0.50%. 

The Nifty sectoral indices, barring the Nifty Metal index, were painted red. In the broader markets, the S&P BSE Midcap and Small cap indices were up 0.13% and 0.3%, respectively. 

The Week That Was–Feb 15 To Feb 19, 2021

Key indices ended with modest losses as investors booked profits after recent rally. Rising global and local bond yields impacted sentiment. The up move was triggered by a range of positive developments, including a high-spending union budget, strong corporate earnings, robust foreign fund flows and progress on COVID-19 vaccinations. 

The Sensex settled below the key 51,000 level while the Nifty ended below the psychological 15,000 mark. Both these indices retreated after scaling record highs. However, the broader markets that are BSE Midcap index and the BSE Small cap Index, both, ended in the green last week.

In the week ended Friday, February 19, 2021, the Sensex dropped 654.54 points or 1.27% to settle at 50,889.76. The Nifty 50 index shed 181.55 points or 1.20% to settle at 14,981.75. The BSE Midcap index rose 124.49 or 0.63% to settle at 20,035.52. The BSE Small cap index added 241.36 points or 1.23% to settle at 19,863.41.

Global Markets

Asian share markets inched higher to day as expectations for faster economic growth and inflation globally batter bonds and boost commodities, though rising real yields also make equity valuations look more stretched in comparison. 

MSCI’s broadest index of Asia-Pacific shares outside Japan added 0.1%, after easing from a record top late last week as the jump in US bond yields unsettled investors.

Japan’s Nikkei recouped 1.0% and South Korea 0.4%, while E-Mini futures for the S&P 500 were a fraction firmer.

Oil, Rupee & FIIs 

Crude Oil: Oil prices have gone along for the ride, aided by tightening supplies and freezing weather, giving Brent gains of 21% for the year so far. Early Monday, Brent crude futures were up 43 cents at $63.34 a barrel, while US crude added 11 cents to $59.35.

Indian Rupee: Buoyed by foreign fund inflow and weaker US dollar, the Indian rupee is trading at its highest level in almost a year. On Friday the rupee closed flat at 72.65 against the greenback, as foreign funds continued to pump monies into Indian markets. 

FPIs: On Friday, foreign institutional investors (FIIs) net bought shares worth Rs 118.75 crore, while domestic institutional investors (DIIs) net sold shares worth Rs 1,174.98 crore in the Indian equity market.

Foreign portfolio investors (FPIs) invested Rs 24,965 crore in Indian markets in February so far. According to depositories’ data, FPIs pumped in Rs 24,204 crore into equities and Rs 761 crore in the debt segment, taking the total net investment to Rs 24,965 crore during February 1-19.

Week Ahead

Trading could be volatile this week as traders roll over positions in the F&O segment from the near month January series to February series. The February 2021 F&O contracts will expire on Thursday.

Trend in global markets, macro data, movement of rupee against the dollar, Brent crude oil price movement and investments by foreign portfolio investors (FPI) and domestic institutional investors (DII) will be watched.

On the macro front, India's gross domestic product (GDP) for the fourth quarter will be released on February 26, 2021. India's infrastructure output data for January will be unveiled on February 26, 2021. 

Global cues will continue to be in focus as resurgence in virus cases around the world, leads to more restrictions and more pressure on economic recovery. Updates related to COVID-19 will be closely watched. Also, on the radar will be news on Covid vaccine development. From here on the pace of the improvement of economic indicators along with outcomes of a possible vaccine or cure for COVID-19 would determine the movement of the market.

China will announce Loan Prime Rate for 1 year and 5 years today. The United States Durable Goods Orders for January will be declared on February 25, 2021.

Sources: Various publications

Disclaimer: The information provided herein is based on publicly available information and other sources believed to be reliable, but involve uncertainties that could cause actual events to differ materially from those expressed or implied in such statements. The document is given for general and information purpose and is neither an investment advice nor an offer to sell nor a solicitation. While due care has been exercised while preparing this document, we do not warrant the completeness or accuracy of the information. We will not accept any liability arising from the use of this material. The recipient of this material should rely on their investigations and take their own professional advice.

Follow, Like, subscribe and share

"Your Trust, Our Financial Expertise."

Infyture, Investment For Your Future

Email: infyture@gmail.com

Website: http://infyture.wordpress.com

Facebook Page: https://www.facebook.com/infyture4future/

Youtube:https://www.youtube.com/channel/UCjOxVGTKQiK5O0mdcuMBCdw?view_as=subscriber

Blogger: https://infyture.blogspot.com/

WhatsApp: https://wa.me/message/SXE3AQCBR3O4B1

Telegram: https://t.me/infyture

Goal Based Planning || Equity Tip || Demat Account || Mutual Fund Investment || Life Insurance || General & Health Insurance || PMS & mini PMS || Retirement Planning || NPS Enrollment

Wednesday, February 10, 2021

IPO Analysis : Nureca Limited IPO

IPO Analysis : Nureca Limited IPO

Nureca Limited is a healthcare and wellness products distributor which got incorporated in 2016. The company aims to offer the best quality, durable, and innovative tools to customers to monitor chronic diseases to improve their lifestyle.


The firm has a well-diversified product portfolio including Chronic Device Products, Orthopedic products, Mother and Child products, Nutrition Supplements, and Lifestyle products to meet the Indian healthcare market requirements. It is the first digital company to sell such products through its website and other online partners i.e. e-commerce players, retailers, and distributors.

Let's discuss the products portfolio of Nureca in a bit detail:

Chronic Device Products – including products such as blood pressure monitors, pulse oximeters, thermometers, nebulizers, self-monitoring glucose devices, humidifiers, and steamers.

Orthopedic Products – including rehabilitation products such as wheelchairs, walkers, lumbar and tailbone supports, and physiotherapy electric massagers.

Mother and Child Products – which includes products such as breast pumps, bottle sterilizers, bottle warmers, car seats, and baby carrycots.

Nutrition Supplements – including products such as fish oil, multivitamins, probiotics, biotin, apple cider, and vinegar.

Lifestyle Products – including products such as smart scales, aroma diffusers, and fitness trackers.

A few products sold by the Company:

    Dr. Trust Wheelchair.
    Dr. Trust Walker.
    Dr. Trust Walker with wheels.
    Dr. Physio Full Body Massager.
    Dr. Trust Fish oil.
    Dr. Trust Multivitamins.
    Dr. Trust Balance Scale.
    Dr. Trust Fitness Tracker Smart band.

Company’s Distribution Network:

Nureca is a digital first company where in company sells the products through online channels partners such as e-commerce players, distributors and retailer.Further, company also sell its products through company’s own website drtrust.in

Currently, 95% of revenues for the Company comes through digital channels (e-Commerce).

Tie up with Croma:

To expand the business footprint, Nureca, in October 2019, joined hands with Croma, India’s first omni-channel electronics retailer from the Tata Group, to emerge as the very first company to sell healthcare and wellness products through Croma stores.

As part of this tie-up, Nureca will sell products from its Dr Trust and Dr Physio brands at 30 Croma stores across the country.

Competition in the Business:

Nureca competes with local and global companies operating in India. The market is extremely fragmented with over fifty players, most of them Indian, with mostly generic products, showcasing no significant competitive advantage in terms of innovation or differentiation.

There are numerous other players in the market, like Dr Morepen, Health Sense, Agaro, Lifelong, Omron, Philips, Johnson and Johnson, Roche, Bayer

Positives for the Company:

Growth in Home Health Segment. : The Home Health Market in India and neighbouring countries is pegged at Rs.20,757.0 crore in 2019 and is expected to grow to Rs.38,920.7 crore by 2025 at a CAGR 11.0%. The growth is driven by rising awareness of Health and wellness, increasing spending power, growing burden of chronic diseases, and the need for Healthcare stakeholders to reduce healthcare costs.

Marketing & Distribution of Products: Company markets and sells the products across India through company’s own website i.e. Dr trust.in and third party e-commerce platforms, distributors and retailers and manage the sales and marketing activities through our Corporate Office. Company believes that this distribution network ensures that the products are easily available in almost any part of India. In addition to leveraging and engaging the distribution network for marketing initiatives, company also undertake direct promotional initiatives like advertising the products through digital marketing.

Reputed Brand with Constant Innovation: Company’s brands i.e Dr. Trust, Dr. Physio and Trumom have built a reputation of introducing innovative products that appeal to Indian customers. Company combines the technical expertise with an understanding of the Indian home healthcare market developed through market feedback and extensive interaction with the vendors. Through these efforts, company seeks to be the first to introduce innovative products in the market with unique functionalities that create new demand.
    
For example, Nureca has launched BP monitors which can be connected to a mobile phone through bluetooth or our own application i.e. Dr. Trust BP Connect App for remote monitoring of the patient.

Other Important Dates and Facts: 


Verdict: Seeing the company structure and future prospects, I think one should apply in this IPO. Since company's main focus is on e Commerce and digital marketing, hence their will not be any question on sustainability of the company. 
Seeing high action in secondary market, one can expect listing gains also. 

Sources: Various publications

Disclaimer: The information provided herein is based on publicly available information and other sources believed to be reliable, but involve uncertainties that could cause actual events to differ materially from those expressed or implied in such statements. The document is given for general and information purpose and is neither an investment advice nor an offer to sell nor a solicitation. While due care has been exercised while preparing this document, we do not warrant the completeness or accuracy of the information. We will not accept any liability arising from the use of this material. The recipient of this material should rely on their investigations and take their own professional advice.

Follow, Like, subscribe and share

"Your Trust, Our Financial Expertise."

Infyture, Investment For Your Future

Email: infyture@gmail.com

Website: http://infyture.wordpress.com

Facebook Page: https://www.facebook.com/infyture4future/

Youtube:https://www.youtube.com/channel/UCjOxVGTKQiK5O0mdcuMBCdw?view_as=subscriber

Blogger: https://infyture.blogspot.com/

WhatsApp: https://wa.me/message/SXE3AQCBR3O4B1
Telegram:
https://t.me/infyture

Goal Based Planning || Equity Tip || Demat Account || Mutual Fund Investment || Life Insurance || General & Health Insurance || PMS & mini PMS || Retirement Planning || NPS Enrollment

Friday, January 15, 2021

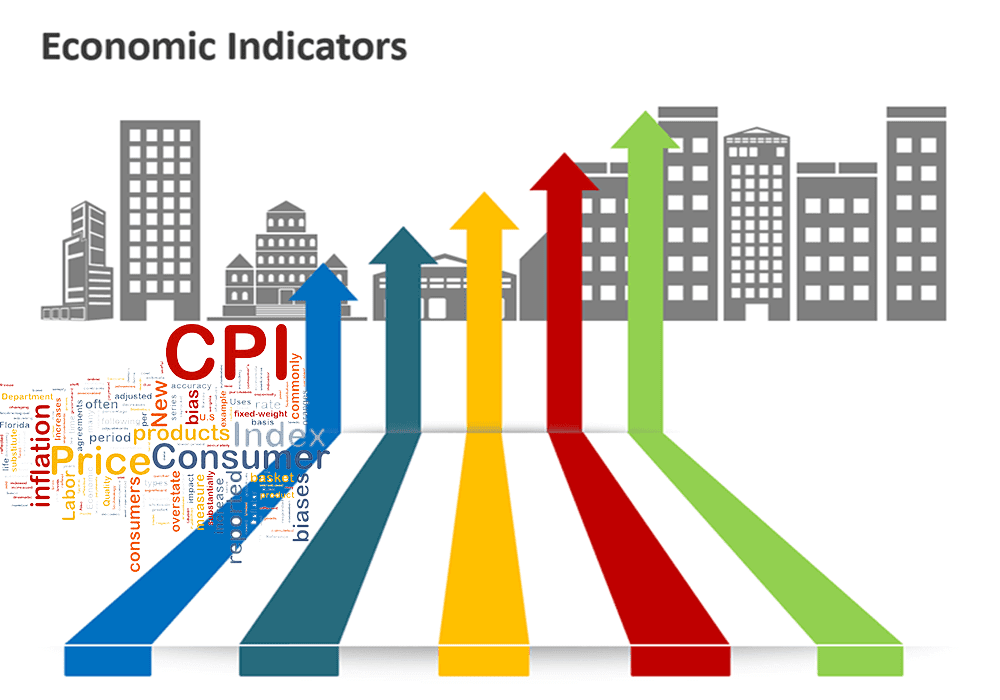
What are Economic Indicators and their Importance

What are Economic Indicators and their Importance


Economic indicators are key stats about the economy that can help you better understand where the economy is headed. These indicators can help investors decide when to buy or sell investments. For example, if the stock market is at its peak, you may want to sell. If the market is low and on the rise, you may want to buy. Economic indicators can help you understand the flow of market, as well as other important financial factors.

Types of Economic Indicators

Leading indicators:
Leading indicators signal future changes. That means, they usually change before the economy itself changes. This makes them extremely useful for short term predictions of economic developments. An example of a leading indicator is the stock market. Stock market returns usually start to decline, before the economy as a whole falls into a recession and vice versa.

Lagging Indicators:
Lagging indicators usually change after the economy as a whole changes. For that reason, they cannot directly be used to predict economic changes. They are more useful to confirm specific patterns (e.g. economic cycles) and make further predictions from there. Arguably the most popular example of a lagging indicator is unemployment. Unemployment usually starts to increase a few quarters after the economy has started to recover from a recession.

Coincident Indicators:
Coincident indicators occur at about the same time as the changes they signal. Therefore, they can provide valuable information about the current state of the economy. An example of a coincident indicator is personal income. If the economy is strong and business is going well, personal income rates will increase at about the same time. 

Attributes of Economic Indicators:
It may possess one of the three following attributes:

Pro cyclical:
It is an indicator that moves in a direction similar to the economy. For example, GDP is pro cyclical because it increases if the economy is performing well. If the economy is not doing well (i.e., recession), GDP decreases.

Counter cyclical:
It is an indicator that moves in the opposite direction of the economy. For example, the unemployment rate declines if the economy is thriving.

A cyclical:
It is an indicator that bears no relationship to the economy at all.


Few Important Economic Indicators:

Gross Domestic Product (GDP)
GDP is a lagging indicator. It is one of the first indicators used to gauge the health of an economy. It represents economic production and growth, or the size of the economy. 

An increase in GDP indicates that businesses are making more money. It also suggests an increase in the standard of living for people in that country. If GDP decreases, then it suggests the reverse.

Balance of Trade
Balance of trade is a lagging indicator. It’s the net difference between a country’s value of imports and exports, and shows whether there is a trade surplus or a trade deficit. A trade surplus is generally desirable, and shows that there is more money coming into the country than leaving. A trade deficit shows that there is more money leaving the country than coming in. Trade deficits can lead to significant domestic debt. In the long term, a trade deficit can result in a devaluation of the local currency, since it leads to significant debt. The increase in debt will reduce the credibility of the local currency. It could also lead to a major financial burden for future generations, since they will be forced to pay off that debt.

Inflation
Inflation measures the cost of goods and services. Inflation has a key effect on economies and markets. For economies, high inflation discourages savings and investment, leads to higher interest rates, and ultimately limits growth. In markets, higher inflation may initially lead to asset price increases, but ultimately investors will pay lower multiples and real wealth will decline. The key reports to focus on are the Producer Price Index (PPI) and Consumer Price Index (CPI). Use a moving average of the year-over-year change and watch for results that are negative (signaling deflation) or over four percent.

Housing  
In a land of increasing house prices, banks lend and the economy booms. However, the housing game has changed. We have lived through the housing collapse, we expect banks to become more prudent for many years. Weakness in housing will lead to a drop in lending and economic contraction. Many reports track housing. New home sales and existing home sales are the most popular. However, I prefer to look at housing starts and building permits. Permits are a leading indicator and offer an assessment of housing demand. When permits are rising, house prices should appreciate as well.

Spending 
We live in a consumption-based society. As consumers increase their expenditures, the economy grows. While many surveys attempt to capture people’s feelings about the state of the economy, behavior is what counts. Look to the monthly retail sales report for an indication of actual consumer activity.

Consumer Price Index (CPI)
CPI is a lagging indicator, and the U.S. relies on it heavily as one of the best indicators of inflation. This is because changes in inflation can spur the Federal Reserve to make changes to its monetary policy.

CPI measures changes in prices paid for goods and services by urban consumers for a specified month. It’s essentially a measure of the cost of living changes. It offers a gauge of inflation as it relates to purchasing those goods and services.

CPI takes a sampling of several hundred goods and services across 200 categories. CPI does not include Social Security taxes, income, or investments in stocks, bonds or life insurance. However, it does include all sales taxes associated with the purchase of those goods.

Producer Price Index (PPI)
PPI is a coincident indicator that tracks price changes in almost all goods-producing sectors, including mining, manufacturing, agriculture, forestry and fishing. PPI also tracks price changes for an increasing portion of the non-goods-producing sectors of the economy. The report measures prices for finished goods, intermediate goods and crude goods. Prices from thousands of establishments are tracked each month and are recorded on the U.S. Bureau of Labor Statistics website.

PPI is important because it’s the first inflation measure available in the month. It captures price movements on a wholesale level, before price changes show up on the retail level.

Interest Rates
Interest rates are a lagging indicator of economic growth. They are based around the federal funds rate, which is determined by the Federal Open Market Committee (FOMC). When the federal funds rate increases, interest rates increase. The federal funds rate increases or decreases as a result of economic and market events.

When interest rates increase, borrowers are more reluctant to take out loans. This discourages consumers from taking on debt and businesses from expanding, and as a result, GDP growth may become stagnant.

If interest rates are too low, that can lead to an increased demand for money and raise the likelihood of inflation. Raising inflation can distort the economy and the value of its currency. Current interest rates are indicative of the economy’s current condition, and can also suggest where the economy might be headed.

Currency Strength
Currency strength is a lagging indicator. When a country has a strong currency, its purchasing and selling power with other nations is increased. A country with a strong currency can import products at a cheaper rate and sell its products overseas at higher foreign prices. However, when a country has a weaker currency, it can draw in more tourists and encourage other countries to buy its goods since they are cheaper.

Manufacturing Activity
Manufacturing is a leading economic indicator. Durable goods orders are an indicator of manufacturing activity. The term “durable goods” refers to consumer products that usually aren’t replaced for at least a few years, such as refrigerators and cars. Near the end of each month, the Department of Commerce Census Bureau publishes its report on durable goods.

Durable goods orders are a measure of new orders manufacturers receive for those types of goods. An increase in durable goods orders is generally taken as a sign of economic health, while a decline might indicate trouble in the economy. Increases and decreases in durable goods orders may also be associated with increases and decreases in stock indices, respectively.

Income and Wages
Income and wages are a lagging indicator. When the economy is operating properly, earnings should increase to keep up with the average cost of living. However, when incomes decline relative to the average cost of living, it is a sign that employers are either laying off workers, cutting pay rates or reducing employee hours. Declining incomes can also indicate an environment where investments are not performing as well.

Incomes are broken down by different demographics, like age, gender, level of education and ethnicity. These demographics can give insight into how wages change for certain groups. A trend that may affect what seems to be only one smaller group may actually suggest an income problem for the entire country, rather than just the group it initially affects.

There’s no golden rule in investing, but considering these economic indicators one can help themself to make informed investment decisions. The Federal Reserve releases a report known as "the Beige Book" eight times per year. The Beige Book outlines the nation’s economic conditions and it can be a useful resource for investors, economists and analysts. Economic indicators are important to take into account before making any investment decisions. With a little research, you’ll be able to maximize

Disclaimer: The information provided herein is based on publicly available information and other sources believed to be reliable, but involve uncertainties that could cause actual events to differ materially from those expressed or implied in such statements. The document is given for general and information purpose and is neither an investment advice nor an offer to sell nor a solicitation. While due care has been exercised while preparing this document, we do not warrant the completeness or accuracy of the information. We will not accept any liability arising from the use of this material. The recipient of this material should rely on their investigations and take their own professional advice.

Follow, Like, subscribe and share

"Your Trust, Our Financial Expertise."

Infyture, Investment For Your Future

Email: infyture@gmail.com

Website: http://infyture.wordpress.com

Facebook Page: https://www.facebook.com/infyture4future/

Youtube:https://www.youtube.com/channel/UCjOxVGTKQiK5O0mdcuMBCdw?view_as=subscriber

Blogger: https://infyture.blogspot.com/

WhatsApp: https://wa.me/message/SXE3AQCBR3O4B1
Telegram:
https://t.me/infyture

Goal Based Planning || Equity Tip || Demat Account || Mutual Fund Investment || Life Insurance || General & Health Insurance || PMS & mini PMS || Retirement Planning || NPS Enrollment

Wednesday, January 13, 2021

IPO Analysis: Indigo Paints Limited

IPO Analysis: Indigo Paints Limited

It is one of the fastest-growing paint companies in India and in terms of revenue, it is the 5th largest company in the decorative paint industry. The company is engaged in manufacturing different types of decorative paints like enamels, emulsions, wood coatings, primers, distemper, putties, and cement paints.


It is the first company that started manufacturing certain differentiated products like Metallic Emulsions, Bright Ceiling Coat Emulsions, Tile Coat Emulsions, Dirt proof & Waterproof Exterior Laminate, Floor Coat Emulsions, Exterior and Interior Acrylic Laminate, and PU Super Gloss Enamel. The sales from these differentiated products are continuously growing as it was 26.68% in 2018 increased to 28.62% in fiscal 2020.

Indigo Paints has a strong market network with dealers in Tier 1, Tier 2, and Metros as well. It has 3 manufacturing facilities situated in Jodhpur (Rajasthan), Kochi (Kerala), and Pudukkottai (Tamil Nadu). It is further looking to expand its manufacturing capacities at Pudukkottai to manufacture water-based paints.

Indigo Paints is a decorative paint manufacturer. Its peers are companies such as Asian Paints, Berger, Kansai Nerolac, and Akzo Nobel. The size of the decorative paints industry in 2019 was Rs 40,300 crores and as per research by Frost & Sullivan, Indigo Paints had about 2% market share.

To create demand for Company’s differentiated products, Indigo paints initially tapped into Tier 3, Tier 4 Cities, and Rural Areas, where brand penetration is easier and dealers have greater ability to influence customer purchase decisions.

Objective of the Issue:

The net proceed from the Indigo Paints IPO will be used against following objectives.
  • To meet the capital expenditure requirements for manufacturing facility expansion at Pudukkottai, Tamil Nadu
  • To purchase tinting machines and gyroshakers.
  • To repay all or certain borrowings.
  • To meet general corporate purposes.


Risk Factors of investing in this IPO

These risk factors can impact company revenue and margins which would affect its share price. Investors should go through these points and understand them before investing.
 
1) An inability to protect, strengthen and enhance its existing company brand could adversely affect its business prospects and financial performance.

2) The continuing impact of the COVID-19 pandemic on its business and operations is uncertain and it may be significant and continue to have an adverse effect on its business, operations and its future financial performance.

3) The company engages in a highly competitive business and any failure to effectively compete could have a material adverse effect.

4) They may not be able to identify or effectively respond to evolving preferences, expectations or trends in a timely manner, and a failure to derive the desired benefits from its product development efforts may impact its competitiveness and profitability.

5) Company’s ability to grow its business depends on its relationships with the dealers and the community of painters, and any adverse changes in these relationships, or company inability to enter into new relationships, could negatively affect business and results of operations.

6) Company does not enter into long-term arrangements with its dealers and any failure to continue existing arrangements could negatively affect its business and results of operations

7) Their proposed capacity expansion plans relating to its manufacturing facilities are subject to the risk of unanticipated delays in implementation and cost overruns.

8) A significant portion of company sales is derived from the state of Kerala and any adverse developments in this market could adversely affect its business.

Verdict: Valuations are highly priced, since their is entry barriers in this sector, hence looks good for long term. Government is also focusing on House for all, this could be the beneficiary. In my view one should invest in this company for listing gains as well as for portfolio.  

Sources: Various publications

 Disclaimer: The information provided herein is based on publicly available information and other sources believed to be reliable, but involve uncertainties that could cause actual events to differ materially from those expressed or implied in such statements. The document is given for general and information purpose and is neither an investment advice nor an offer to sell nor a solicitation. While due care has been exercised while preparing this document, we do not warrant the completeness or accuracy of the information. We will not accept any liability arising from the use of this material. The recipient of this material should rely on their investigations and take their own professional advice.

Follow, Like, subscribe and share

"Your Trust, Our Financial Expertise."

Infyture, Investment For Your Future

Email: infyture@gmail.com

Website: http://infyture.wordpress.com

Facebook Page: https://www.facebook.com/infyture4future/

Youtube:https://www.youtube.com/channel/UCjOxVGTKQiK5O0mdcuMBCdw?view_as=subscriber

Blogger: https://infyture.blogspot.com/

WhatsApp: https://wa.me/message/SXE3AQCBR3O4B1

Telegram: https://t.me/infyture

Goal Based Planning || Equity Tip || Demat Account || Mutual Fund Investment || Life Insurance || General & Health Insurance || PMS & mini PMS || Retirement Planning || NPS Enrollment

IPO Analysis : Indian Railway Finance Corporation Limited

IPO Analysis : Indian Railway Finance Corporation Limited

The Indian Railway Finance Corporation (IRFC) incorporated in 1986 is a public-sector enterprise that is wholly-owned by the Government of India. IRFC is primarily engaged in financing the acquisition of rolling stock assets, leasing of railway infrastructure assets, and lending to entities under the Ministry of Railways (MoR). Being the borrowing arm of Indian Railways, IRFC is responsible to raise funds for MoR that is required to procure rolling stock assets (wagons, trucks, electric multiple units, locomotives, coaches), its improvement, expansion, and assets management.

It follows a financial leasing model to finance rolling stock assets procurement for a lease period of 30 years. In fiscal 2019, the actual capital expenditures by the Indian Railways were Rs. 1,334 billion, out of which, IRFC financed Rs. 525.35 bn accounting for 39.34% expenditures.

IRFC (Indian Railway Finance Corporation) is in the principal business of borrowing funds from the financial markets to finance the acquisition/creation of assets which are then leased out to the Indian Railways or any entity under the Ministry of Railways. As per the DRHP, IRFC is registered with the RBI as an NBFC-ND-IFC (i.e. a Non-Deposit accepting Infrastructure Finance Company). The public issue will be in the form of new shares issued by the company as well as an offer for sale by the Government (which is currently the sole shareholder in IRFC).

Key Strengths
  •     Strategic role in Indian Railways growth.
  •     Sound credit rating i.e. CRISIL AAA/A1+ and ICRA AAA/A1+.
  •     Competitive cost of borrowing.
  •     Strong financial performance.
  •     Sound asset-liability management.
  •     Experienced management team.
Objective of the Issue: The net IPO proceeds are proposed to be utilized for the following objects:
  •     To augment company's equity capital base to meet business future growth requirements.
  •     To meet general corporate purposes.


Important Dates to Remember:

13th Jan – Announcement of Price Band
15th Jan – Anchor Investors Allotment
18th Jan – Offer Opens
20th Jan – Offer Closes
25th Jan – Finalization of Basis of Allotment
27th Jan – Unblocking of ASBA Accounts
28th Jan – Credit of Equity Shares to Depository Accounts
29th Jan – Commencement of Trading

Verdict: Since it is a first PSU NBFC getting listed on exchange, and it is responsible for financing of 85% railway projects, future is good with good margins. Grey market price is Rs 2 (as on 13th January 2021). In my view one can apply for this IPO. 


OPEN DEMAT AND TRADING ACCOUNT in Edelweiss Broking

CLICK HERE 👇 to open account now.

https://bit.ly/31Hb1w5

India Best stock broker offering flat Rs 10 per trade, Lowest brokerage fee in Stock market Industry.

No AMC charge for first year.

Edelweiss mobile App is awarded INDIAs No. 1 Platform.

No hidden charges.

Don't wait open your Demat and trading account now in 15 minutes.

CLICK HERE 👇 to open account now.

https://bit.ly/31Hb1w5

#Infyture

Sources: Various publications

Disclaimer: The information provided herein is based on publicly available information and other sources believed to be reliable, but involve uncertainties that could cause actual events to differ materially from those expressed or implied in such statements. The document is given for general and information purpose and is neither an investment advice nor an offer to sell nor a solicitation. While due care has been exercised while preparing this document, we do not warrant the completeness or accuracy of the information. We will not accept any liability arising from the use of this material. The recipient of this material should rely on their investigations and take their own professional advice.

Follow, Like, subscribe and share

"Your Trust, Our Financial Expertise."

Infyture, Investment For Your Future

Email: infyture@gmail.com

Website: http://infyture.wordpress.com

Facebook Page: https://www.facebook.com/infyture4future/

Youtube:https://www.youtube.com/channel/UCjOxVGTKQiK5O0mdcuMBCdw?view_as=subscriber

Blogger: https://infyture.blogspot.com/

WhatsApp: https://wa.me/message/SXE3AQCBR3O4B1

Telegram: https://t.me/infyture

Goal Based Planning || Equity Tip || Demat Account || Mutual Fund Investment || Life Insurance || General & Health Insurance || PMS & mini PMS || Retirement Planning || NPS Enrollment

Monday, November 2, 2020

Result Analysis : Reliance Industries – Q2FY21

Result Analysis : Reliance Industries – Q2FY21

Total revenue from operations at 128,385 Cr
165,228 Cr (-22.95%) YoY | 100,929 Cr (27.32%) QoQ

Six month revenue 229,314 Cr Vs. 339,315 Cr (-32.48%)

Net Profit of 10,602 Cr
11,352 Cr (-6.63%) YoY 13,248 Cr (-19.94%) QoQ

Six month profit 23,850 Cr Vs. 21,493 Cr (10.91%)

Before exceptional Item:
EPS (in Rs) 14.68 
18.47 YoY |12.89 QoQ

Before exceptional item:
Six month EPS 27.39 Vs. 35.03

View: Result is in line with the market expectation. YoY revenue declined and profit also declined due to impact of their petroleum & gas business in YoY and QoQ which is partially offset by strong performance by Reliance JIO and retail business. Quarter ending June 2020 profit was higher by INR 4.9K Crs towards exceptional gain so net profit was not comparable with Q2FY21. H1FY21 profit was also higher by said amount. 

Business Updates & Highlights

EBITDA (Cons.) before exceptional items for the quarter was INR 23,299 crore Vs. 25,766 Cr Vs. 21,585 Cr in QoQ therefore declined by 9.5% in YoY and up by 7.9% in QoQ. 

Finance cost was around INR 6,084 Cr Vs. 5,450 Cr in YoY Vs. 6,735 Cr in QoQ therefore up by 11.6% in YoY and declined by 9.65 in QoQ.

Exports (including deemed exports) from RIL’s India operations in Q2FY21 was INR 34,581 crore as against INR 53,161 crore in Q2FY20 Vs. 32,581 Cr in Q1FY21 therefore declined by 34.9% in YoY and up by 5.6% in QoQ. 

Reliance Jio
Revenue including access revenues for the quarter was INR 21,708 crore VS. 14,562 Cr in YoY Vs. 20,277 Cr in QoQ therefore up by 49% in YoY and 7.1% in QoQ. 

EBITDA for the quarter was INR 7,971 crore Vs. 5,166 Cr Vs. 7,332 Cr and increase of 55.4% YoY and 8.7% in QoQ. EBITDA Margin was around 43.1% Vs. 41.8% Vs. 42.5% in QoQ therefore up by 130 bps in YoY and 60 bps in QoQ. 

H1FY21 EBITDA was around INR 15,303 Cr and EBITDA margin was around 42.8%.

Net profit in Q2FY21 was INR 3,020 Cr Vs 990 Cr in Q1FY20 Vs. 2,520 Cr in Q1FY21 therefore up by 205% in YoY and 19.8% in QoQ. H1FY21 Net profit was INR 5,540 Cr.

Total Customer base as on 30th June 2020 of 405.6 million. Largest customer base in country.

RELIANCE JIO Q1 ARPU RS 145 Vs. 120 in Q2FY20 Vs. 140.3 in Q1FY21. Its improved in YoY and QoQ.

Total wireless data traffic during the quarter of 1,442 crore GB Vs. 1,420 Cr (1.5% QoQ growth). 

Wireless gross addition showed a strong sequential increase to 27.2 million as lockdown restrictions began to ease during the quarter.

JPL has completed the fund raising of INR 152,056 crores across thirteen global investors which includes Facebook, Google etc. All of these investments, excluding Google, have been completed post fulfilling applicable conditions and total amount of INR 118,319 crore has been received by the Company.

Reliance Retail

Revenue for the quarter was INR 41,100 crore Vs. 41,202 in YoY Vs. 31,620 Cr in QoQ therefore slightly down in YoY and up by 30% in QoQ due to lockdown ease in part of the country.

Revenue for the H1FY21 was around INR 72,720 Cr Vs. 79,398 Cr in H1FY20 therefore declined by 8.4% in YoY. 

EBITDA for the quarter was INR 2,006 crore Vs. 2,322 Cr in YoY Vs. 1,079 Cr in QoQ therefore declined by 15.7% in YoY and up by 85.9% in QoQ. EBITDA margin was around 5.5% Vs. 5.8% in YoY Vs. 3.8% in QoQ.

H1FY21 EBITDA was around INR 3,092 Cr Vs. 4,390 Cr in H1FY20 therefore declined by 29.7% in YoY. 

The current footprint of the business spans across 11,931 retail stores in over 7,000 towns with 29.7 million sq. ft. of retail space. Entered pharma category during the quarter. 

JioMart Kirana partnerships were extended to 20 cities during the period with 4X increase in orders over 1Q FY21. With a strong value proposition and uninterrupted service despite operating constraints, JioMart continues to win the trust of Kirana partners

Petrochemicals business
Revenue of Q2FY21 was INR 29,665 Cr Vs. 38,538 Cr in YoY Vs. 25,192 Cr in QoQ therefore declined by 23% in YoY and up by 17.8% in QoQ.

Revenue for H1FY21 was around INR 54,857 Cr Vs. 76,149 Cr in H1FY20 therefore declined by 28% in YoY. 

EBITDA of Q2FY21 was around INR 5,964 Cr Vs. 8,946 Cr in Q2FY20 Vs. 4,430 Cr in Q1FY21 therefore declined by 33.4% in YoY and up by 34.6% in QoQ.

EBITDA margin was around 20.1% Vs. 23.2% in YoY Vs. 20.1% in QoQ. 

Cracking margins for Reliance improved Q-o-Q due to feedstock mix and favourable economics for ethane cracking. RIL crackers operated at near 100% utilisations during the quarter

PP margins reduced by 21% ($ 126/MT) due to higher feedstock prices despite robust demand from health & hygiene applications. PE margins remained stable ($ 478/MT) with firm demand from packaging sector. PVC margins improved by 14% ($546/MT) led by strong demand recovery in agri and construction sector.

PX-Naphtha delta declined 37% Q-o-Q ($ 136/MT) with sharp increase in naphtha price while PTA margins declined by 14% Q-o-Q ($107/MT) in well-supplied markets. PX and PTA markets were also impacted by start-up of new capacities in China.

Refining & Marketing business
Revenue of Q2FY21 was INR 62,154 Cr Vs. 97,229 Cr in Q2FY20 Vs. 46,642 Cr in Q1FY21 therefore declined by 36% in YoY and up by 34.7% in QoQ.

EBITDA in Q2FY21 was around INR 3,002 Cr Vs. 5,896 Cr in YoY Vs. 3,818 Cr in QoQ therefore declined by 49.1% in YoY and 21.4% in QoQ

EBITDA margin was 4.8% Vs. 8.2% in YoY therefore declined by 340 bps in QoQ . Production (MMT) 15.3 Vs. 16.7 in YoY Vs. 16.6 in QoQ.

GRM ($/bbl) was around 5.7 in Q2FY21 Vs. 9.4 in Q2FY20 Vs. 6.3 in Q1FY21. Therefore significantly declined in YoY and also corrected in QoQ.

Segment EBITDA for 2Q FY21 declined by 21.4% QoQ to INR 3,002 crore primarily on account of lower middle distillates cracks and narrower light-heavy crude differential leading to higher crude cost. The performance was also partially affected by planned turnaround during the quarter.

Reliance BP Mobility Limited (“RBML”), a joint venture (JV) of RIL and BP operated 1,406 fuel retail outlets. Against industry growth of 5.3% and 41.1% Q-o-Q in HSD and MS, RBML clocked 15.1% and 55.4% respectively.

Media Business

Revenue for Q2FY21 was around INR 1,061 Cr Vs. 1,174 Cr in Q2FY20 Vs. 807 Cr in Q1FY21 therefore declined by 9.6% in YoY and up by 31.5% in QoQ.

EBITDA in Q2FY21 was around INR 166 Cr Vs. 68 Cr in YoY Vs. 27 Cr in QoQ. Therefore significantly improved in QoQ. EBITDA margin in Q2FY21 was around 15.6% Vs. 3.3% in QoQ.

TV viewership has now settled at ~1.1x pre-COVID levels. Pay-TV has clawed back its share from free-to-air channels, as entertainment programming is back in full-swing. 

An increased propensity to pay for content has been witnessed. Flagship properties MoneyControl and Voot have witnessed rapid growth in subscribers

Financial
ROE and ROCE is around 10.3% and 10.7% respectively and book value per share is around INR 970 per share and share is currently trading at 2.5x of its book value. Company is currently trading at annualized PE of 36 around which is average as per Industry benchmark. Promoter holding in the company is around 50.5% which is slightly increased by YoY and QoQ. Insurance cos, FIIs and mutual fund hold around 25.2%, 5.1% and 5.9% respectively. **Operating cash flow as of Sep 2020 was INR (12,305 Cr) Vs. 53,482 Cr in Sep 2019**

View Share price high 2,368 and now 2,055 . Reliance Industries Limited (RIL) is an Indian multinational conglomerate company. Reliance owns businesses across India engaged in energy, petrochemicals, textiles, natural resources, retail, and telecommunications.

Position: Strong support is INR 2000/1950. Long term investor should continue with the company with target price of INR 3000 any correction will give good opportunity to enter Reliance on SIP basis.

Opportunities Reliance Industries is currently no.1 company In India in terms of market capitalization and outperform for past 3 years. Reliance is diversified group now and its more focused now on Retail and digital services (JIO) and partially setoff the pressure and margin of Refining and Petrochemical business. The current growth of Retail and Digital services business is excellent and Reliance has overtaken to Airtel and Vodafone Idea as now No.1 Telecom Company in India on subscription base as well as revenue base also. As 5G is under process and more looking into digital media space the growth is evitable. Petroleum & refining company currently technology driven company with highly diversified their business model. 

Reliance JIO Jio has become the only operator (outside China) to have reached the milestone of 400 million subscribers in a single country market. Wireless gross addition showed a strong sequential increase to 27.2 million as lockdown restrictions began to ease during the quarter. Jio Platforms expanded efforts to develop open and interoperable interface compliant architecture based 5G solution with a virtualized RAN. Very aggressive player to increase their customer base on MoM (Net customer addition of 7.3 Mn in this quarter), every quarter exceptionally well growth for topline as well as bottom line, Quarterly EBITDA run rate crossed $1 billion. Sequential improvement in ARPU at INR 145 vs. INR 140 in 1Q FY21. Qualcomm Technologies and Jio achieved over a 1 Gbps milestone on the Reliance Jio 5GNR solution with a Tier-I carrier in the US. JPL has completed the fund raising of INR 152K crores across thirteen global investors which includes Facebook, Google etc. 

Reliance Retail Strong recovery in revenues with EBITDA almost doubling sequentially as compare with Q1 however still not pre Covid level. Store functioning continued to be impacted, but progressively eased during quarter, 85% stores operational (1Q: 50%), of which half could operate fully. 232 new stores launched in quarter as operating curbs are lifted, total stores currently are 11,932. Gross revenue is more than 41K Cr in this quarter and EBITDA was around 2K Cr. Digital commerce continues to grow customers and scale Led by JioMart, AJIO and RelianceDigital. Kirana partnerships extended to 20 cities; orders up 4X while providing uninterrupted supplies. Various acquisition eg. Future group (subject to regulatory approval), Netmeds, Grab, C-square etc. to largest player in the retail sector. Largest fund raise in India in consumer / retail sector from marquee global investors around 37.7K Cr 

More Value will be more unlocked for shareholders once Reliance comes with IPO of Reliance Digital and Reliance Retail

Risk : Reliance two main businesses Petrochemicals and Refining continuously declined in YoY and QoQ despite they were covered still covered 56% dependent on topline in this quarter. GRM ($/bbl) corrected in QoQ and YoY. In bottom line this segment covers around 57% and declined by more than 40% in YoY. Deal with Aramco is also put on hold and currently no clarity on this matter. 

Sources: Various publications

Disclaimer: The information provided herein is based on publicly available information and other sources believed to be reliable, but involve uncertainties that could cause actual events to differ materially from those expressed or implied in such statements. The document is given for general and information purpose and is neither an investment advice nor an offer to sell nor a solicitation. While due care has been exercised while preparing this document, we do not warrant the completeness or accuracy of the information. We will not accept any liability arising from the use of this material. The recipient of this material should rely on their investigations and take their own professional advice.

Follow, Like, subscribe and share

"Your Trust, Our Financial Expertise."

Infyture, Investment For Your Future

Email: infyture@gmail.com

Website: http://infyture.wordpress.com

Facebook Page: https://www.facebook.com/infyture4future/

Youtube:https://www.youtube.com/channel/UCjOxVGTKQiK5O0mdcuMBCdw?view_as=subscriber

Blogger: https://infyture.blogspot.com/

Goal Based Planning || Equity Tip || Demat Account || Mutual Fund Investment || Life Insurance || General & Health Insurance || PMS & mini PMS || Retirement Planning || NPS Enrollment

Disable copy